Directions(1-5): Answer the questions based on the given information.
The graph given below shows the total number of tickets of Movie Mission Mangal and percentage of tickets sold by PhonePe on five different days.
Total number of tickets sold = Tickets sold by Paytm + Tickets sold by PhonePe

- What is the number of tickets sold by Paytm on Monday?
800740720840750Option D
Number of tickets = 840 - What is the difference between number of tickets sold by Paytm on Saturday and Sunday ?
400600200500100Option B
Difference = 960 – 360 = 600 - What is the average number of tickets sold by Paytm between Friday and Saturday ?
700710720730740Option C
Average = (960+360+840)/3 = 720 - What is the average number of tickets sold by PhonePe Friday to Tuesday?
915900925936910Option D
Average = (840+640+440+1560+1200)/5 = 936 - Total number of tickets sold on Saturday is what percent on Sunday ?
250%150%200%300%100%Option C
Percentage = 1600/800*100 = 200% - Red Umbrellas sold on Thursday are how much percent more or less than White Umbrellas sold on Monday?
15.7%14.4%13.9%11.1%12.5%Option E
Required% = {(320-280)/320}*100 = 12.5% - What is the average number of Red Umbrellas sold by the shopkeeper on each of the given day ?
345300320333315Option A
Average = (400+400+320+280+325)/5 = 345 - Number of Red and White Umbrellas sold on Saturday is 20% more and 20% less than the same on Friday. Find the total number of Umbrellas on Saturday.
600650610625620Option C
Number of Red Umbrellas sold on Saturday = 1.2*325 = 390
Number of White Umbrellas sold on Saturday = 0.8*275 = 220
Total number of Umbrellas = 610 - What is the ratio of Red Umbrellas sold on Wednesday to White Umbrellas sold on Tuesday?
7:195:129:148:117:13Option D
Ratio = 8:11 - What is the average of Red Umbrellas on Monday and Wednesday?
300325360400410Option C
Average = [400+320]/2 = 720/2 = 360
Directions(6-10): Answer the questions based on the following answers.
The graph given given below shows the total number of Umbrellas sold by a shopkeeper on five different days.
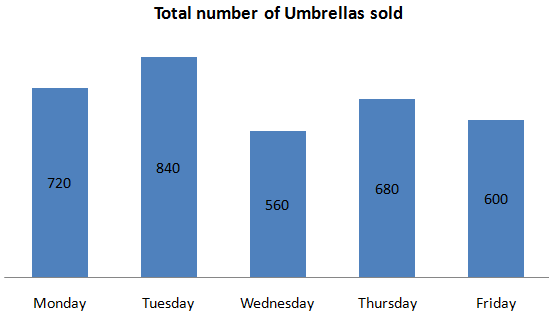
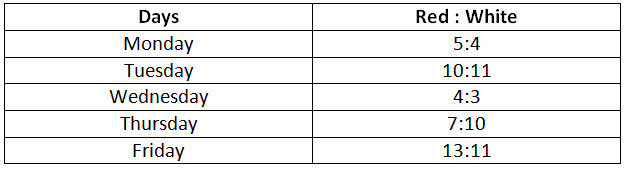
Out of the total number of Umbrellas sold, some are Red and rest are White in colour. The table given which shows the ratio of Red to White Umbrellas on five different days.
530034 634005I discovered your weblog web site internet site on the internet and appearance some of your early posts. Continue to maintain inside the great operate. I just now additional increase your Rss to my MSN News Reader. Seeking toward reading far much more from you finding out at a later date! 547050
936649 216665Usually I dont learn post on blogs, nevertheless I wish to say that this write-up quite pressured me to try and do it! Your writing taste has been surprised me. Thank you, quite excellent write-up. 762572